Scientists have been charting the bottom of the Gulf of Mexico off the coasts of Texas and Louisiana for three-quarters of a century. Hundreds of surveys have provided glimpses of different regions, in different levels of detail. But only recently did all of that work come together. Scientists from Texas A&M University compiled decades of work to produce sharp digital maps of the hidden sea floor.
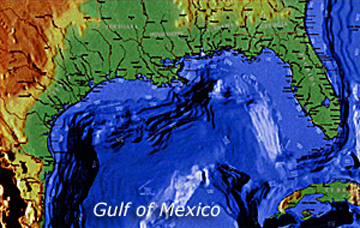 Scientists compiled data to produce digital maps of the bottom of the Gulf of Mexico. Credit: USGS
The modern era of measuring Gulf depths began in the 1930s, when scientists dropped weighted lines over the side of a ship to measure the depth. By the 1940s, they’d started “pinging” the bottom with sonar. And later, they used more advanced sonar to build 3-D images.
The Texas A&M scientists combined all of those techniques in their map-making project, putting together three-and-a-half million observations made by almost 300 surveys. That allowed them to produce detailed maps of the relatively shallow continental shelf and the continental slope, which leads to the deep Gulf.
The scientists had to adjust the measurements to account for errors or just differences in techniques. And close to shore, they had to account for changes caused by decades of storms, runoff, and human-made structures. But the project yielded maps of tens of thousands of square miles of ocean floor.
Combined with other techniques, the maps help geologists piece together the history of that part of the Gulf of Mexico, revealing new details about rising sea levels and other changes over the millennia.
This episode of Science & the Sea was made possible by Texas Sea Grant.
